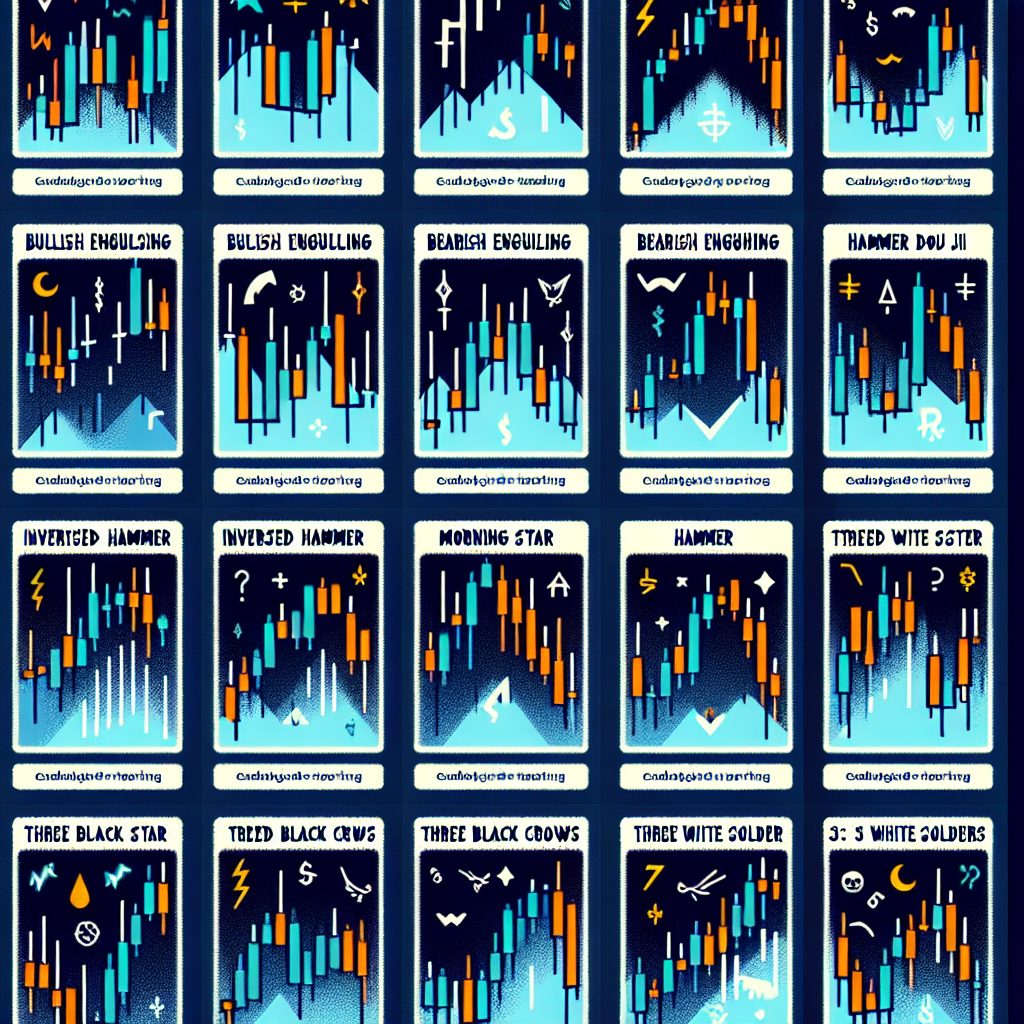
# Candlestick patterns for trading
Candlestick patterns have been a cornerstone of technical analysis in trading for centuries. Originating from Japan in the 18th century, these patterns have stood the test of time and continue to be a popular tool among traders to forecast potential market movements. In this comprehensive article, we will delve into the intricacies of candlestick patterns, their significance in trading, and how traders can utilize them to make informed decisions.
## Understanding Candlestick Patterns
Candlestick patterns are a form of financial chart representation used to demonstrate the price movements of securities, derivatives, or currency pairs over time. Each candlestick typically represents one day of trading activity, but they can also be configured to represent different time frames, such as an hour, a week, or even a month.
### The Anatomy of a Candlestick
A candlestick consists of a body and wicks (or shadows) that extend from the top and bottom. The body represents the open and close prices, while the wicks show the high and low prices during the candle's time period.
– **Bullish Candlestick**: When the close is higher than the open, indicating buying pressure.
– **Bearish Candlestick**: When the close is lower than the open, indicating selling pressure.
### The Significance of Colors
Candlesticks are often colored to make it easier to distinguish between bullish and bearish periods:
– **Green/White**: Typically used for bullish candlesticks.
– **Red/Black**: Commonly used for bearish candlesticks.
## Single Candlestick Patterns
Single candlestick patterns can provide valuable insights into market sentiment. Here are some of the most commonly used single candlestick patterns:
### The Hammer and Inverted Hammer
– **Hammer**: This pattern occurs at the bottom of a downtrend and suggests a potential reversal. It has a small body at the top with a long lower wick.
– **Inverted Hammer**: Also a reversal pattern, it appears at the bottom of a downtrend and has a small body at the lower end with a long upper wick.
### The Doji
A Doji represents indecision in the market, where the open and close prices are virtually equal. The lengths of the wicks can vary, and there are several types of Doji patterns, such as the Gravestone Doji and Dragonfly Doji.
### The Spinning Top
This pattern has a small body with long wicks on both ends, indicating a tug-of-war between buyers and sellers where neither gains significant ground.
## Multi-Candlestick Patterns
Multi-candlestick patterns are formed over two or more trading sessions and can signal stronger market movements compared to single candlestick patterns.
### Bullish and Bearish Engulfing Patterns
– **Bullish Engulfing**: A two-candle pattern where a small bearish candle is followed by a larger bullish candle that completely engulfs the first candle, indicating a potential upward trend.
– **Bearish Engulfing**: The opposite of the bullish engulfing, where a small bullish candle is followed by a larger bearish candle, suggesting a downward trend.
### The Morning Star and Evening Star
– **Morning Star**: A three-candle pattern that signals a bullish reversal. It consists of a large bearish candle, a small-bodied candle, and a large bullish candle.
– **Evening Star**: The bearish counterpart to the Morning Star, indicating a potential bearish reversal.
### The Three White Soldiers and Three Black Crows
– **Three White Soldiers**: This pattern is characterized by three consecutive long-bodied bullish candles, each closing higher than the previous, suggesting a strong upward trend.
– **Three Black Crows**: Conversely, this pattern consists of three long-bodied bearish candles, each closing lower, indicating a strong downward trend.
## How to Trade Using Candlestick Patterns
Trading based on candlestick patterns requires careful analysis and a solid understanding of market context. Here are some steps to consider:
1. **Identify the Pattern**: Recognize the candlestick pattern and confirm its validity with the appropriate time frame.
2. **Confirm with Additional Indicators**: Use other technical analysis tools like moving averages, RSI, or MACD to confirm the signal provided by the candlestick pattern.
3. **Set Entry and Exit Points**: Determine where to enter and exit the trade based on the pattern's implications.
4. **Manage Risk**: Always use stop-loss orders to manage potential losses if the market moves against your position.
## Examples and Case Studies
Let's look at some real-world examples to illustrate how candlestick patterns can be used in trading:
### Example 1: The Bullish Engulfing Pattern
A trader spots a bullish engulfing pattern at the end of a downtrend on the daily chart of a stock. They confirm the pattern with a rising RSI and enter a long position at the opening of the next candle. The stock continues to rise, and the trader exits the position after a predetermined profit target is reached.
### Example 2: The Evening Star Formation
An evening star formation appears at the top of an uptrend in a currency pair. The trader waits for the next candle to close below the third candle of the pattern and enters a short position. They set a stop-loss above the high of the pattern and take profit at a support level identified on the chart.
## Statistics and Research
Research has shown that certain candlestick patterns have statistically significant predictive power. For example, a study published in the “Journal of Economics and Finance” found that the bullish engulfing pattern has a success rate of around 65% in forecasting upward price movements.
## Conclusion
Candlestick patterns are a valuable tool for traders, offering visual cues about market sentiment and potential price movements. While no single pattern guarantees success, when combined with other technical analysis methods and sound risk management, candlestick patterns can enhance a trader's ability to make informed trading decisions. Remember to always backtest patterns and practice on a demo account before applying these strategies to live trading.


